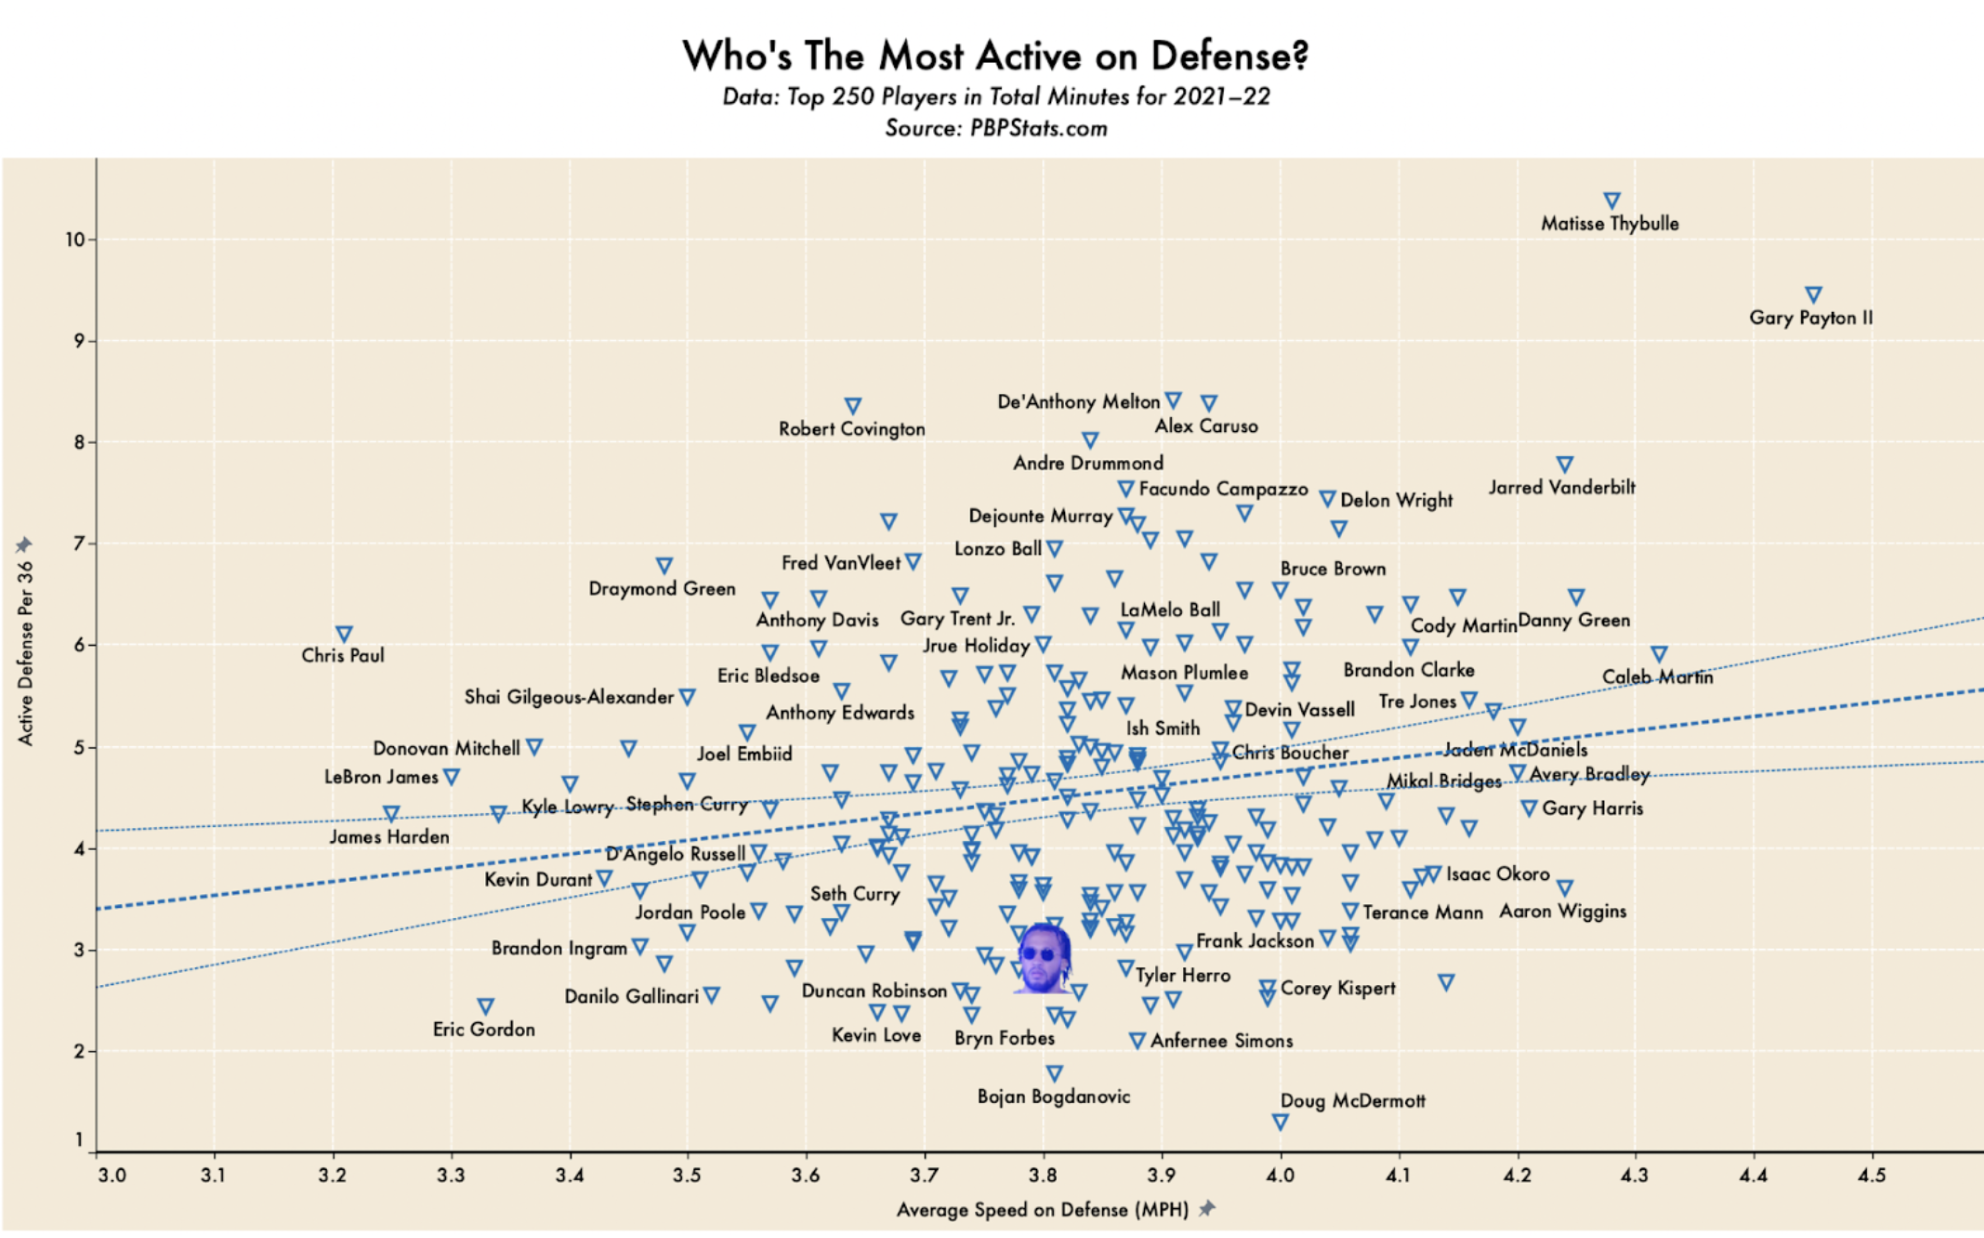
Figure 1.1 — This graph compares Brunson’s average defensive speed to active defense per 36 minutes. Higher = more activity; farther right = faster. Brunson sits near lower-middle: below-average speed and moderate activity.
Interpretation
The placement suggests Brunson is not a top containment defender and should not be tasked with guarding the fastest opponents or largest court areas. The visualization benefits from starting the Y-axis at 3.0 to spread points; consider adding color-coding (good/bad) for clarity.
Source
Source: The Strick Land